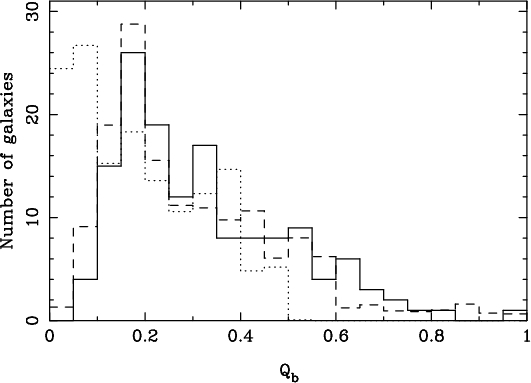
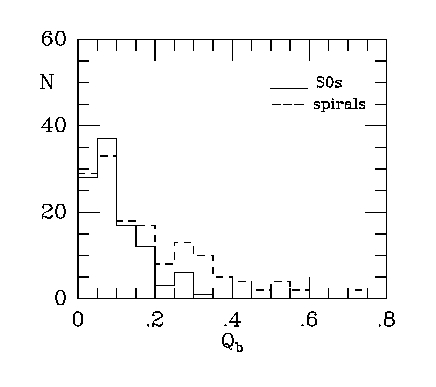
(Left): Predicted distributions of bar strengths for numerically simulated galaxies without any external gas accretion (dotted histogram) and with external gas accretion (dashed histogram), as compared to the observed distribution of bar strengths for OSUBGS spiral galaxies (Block et al. 2002; Bournaud and Combes 2002). This shows that models with gas accretion compare better with the observed distribution of bar strengths for spirals. (Right): The distribution of bar strengths in S0 and spiral galaxies, where the latter is based on an analysis that removed the effects of spiral arm torques. The histograms differ in that S0s do not show an extended tail of high bar strength galaxies, as was found theoretically for galaxies which do not accrete gas from the outside. This will be discussed further in Buta et al. (2009).